Health Monitoring
The Health Monitoring service enhances observability, enabling shorter investigation times and facilitating both high-level and detailed drill-downs.
Before You Begin
It is essential that you follow these prerequisites:
Log files must be saved as
JSONfilesConfigure Grafana authentication, even if you’re using LDAP for authentication management
Installation
All Health Monitoring-related installations are on a stand-alone installations.
Grafana
Grafana is an open-source analytics and monitoring platform designed for visualizing and analyzing real-time and historical data through customizable dashboards. It offers both an open-source version and an enterprise edition, catering to varying needs and scales of deployment.
For more details, refer to the Grafana specification.
Note
Log in as root user.
Disabling SELinux
Check for the current SELinux status:
getenforceOpen the SELinux configuration file:
vim /etc/sysconfig/selinuxConfigure
SELINUXto bedisabled:SELINUX=disabledReboot your system:
reboot
Installing Grafana via YUM Repository
Create a repo file:
vim /etc/yum.repos.d/grafana.repoAdd the following flags to the repo file:
[grafana]
name=grafana
baseurl=https://packages.grafana.com/oss/rpm
repo_gpgcheck=1
enabled=1
gpgcheck=1
gpgkey=https://packages.grafana.com/gpg.key
sslverify=1
sslcacert=/etc/pki/tls/certs/ca-bundle.crt
Install Grafana
sudo yum install grafanaThe installed package performs the following actions:
Installs the Grafana server binary at
/usr/sbin/grafana-serverCopies the init.d script to
/etc/init.d/grafana-serverPlaces the default configuration file in
/etc/sysconfig/grafana-serverCopies the main configuration file to
/etc/grafana/grafana.iniInstalls the systemd service file (if systemd is supported) as
grafana-server.serviceBy default, logs are written to
/var/log/grafana/grafana.log
Install free type and urw fonts:
yum install fontconfig
yum install freetype*
yum install urw-fonts
Enabling the Grafana Service
Check for the service status:
systemctl status grafana-serverIf not active, start the service:
systemctl start grafana-serverEnable the Grafana service on system boot:
systemctl enable grafana-server.service
Modifying your Firewall
Enabling the Grafana port:
firewall-cmd --zone=public --add-port=3000/tcp --permanentReload Firewall service:
firewall-cmd --reload
Prometheus
Prometheus is an open-source monitoring and alerting toolkit designed for reliability and scalability. Prometheus can be used to scrape and store metrics, enabling real-time monitoring, alerting, and analysis of performance and health.
Your sqream installation includes a Prometheus yml file.
Download Prometheus.
Set the YML path:
PROMETHEUS_YML_PATH=<GRAFANA_PROJECT_PATH>/ymls/prometheus.ymlRun the following script:
Prometheus_Server_install () {
        echo "Prometheus_Server_install"
        sudo useradd --no-create-home --shell /bin/false prometheus
        sudo mkdir /etc/prometheus
sudo mkdir /var/lib/prometheus
sudo touch /etc/prometheus/prometheus.yml
cat <<EOF | sudo tee /etc/prometheus/prometheus.yml

#node_exporter port : 9100
#nvidia_exporter port: 9445
#process-exporter port: 9256

global:
  scrape_interval: 10s

scrape_configs:
  - job_name: 'prometheus'
        scrape_interval: 5s
        static_configs:
          - targets:
                - 0.0.0.0:9090
  - job_name: 'prosesses'
        scrape_interval: 5s
        static_configs:
          - targets:
                - <process exporters iP>:9256
                - <another process exporters iP>:9256
  - job_name: 'nvidia'
        scrape_interval: 5s
        static_configs:
          - targets:
                - <nvidia exporter IP>:9445
                - <another nvidia exporter IP>:9445
  - job_name: 'nodes'
        scrape_interval: 5s
        static_configs:
          - targets:
                - <node exporter IP>:9100
                - <another node exporter IP>:9100
EOF
# Assign ownership of the files above to prometheus user
sudo chown -R prometheus:prometheus /etc/prometheus
sudo chown prometheus:prometheus /var/lib/prometheus

# Download prometheus and copy utilities to where they should be in the filesystem
#VERSION=2.2.1
#VERSION=$(curl https://raw.githubusercontent.com/prometheus/prometheus/master/VERSION)
#wget https://github.com/prometheus/prometheus/releases/download/v2.31.1/prometheus-2.31.1.linux-amd64.tar.gz
wget ftp://drivers:drivers11@ftp.sq.l/IT-Scripts+Packages/prometheus-2.31.1.linux-amd64.tar.gz

tar xvzf prometheus-2.31.1.linux-amd64.tar.gz

sudo cp prometheus-2.31.1.linux-amd64/prometheus /usr/local/bin/
sudo cp prometheus-2.31.1.linux-amd64/promtool /usr/local/bin/
sudo cp -r prometheus-2.31.1.linux-amd64/consoles /etc/prometheus
sudo cp -r prometheus-2.31.1.linux-amd64/console_libraries /etc/prometheus

# Assign the ownership of the tools above to prometheus user
sudo chown -R prometheus:prometheus /etc/prometheus/consoles
sudo chown -R prometheus:prometheus /etc/prometheus/console_libraries
sudo chown prometheus:prometheus /usr/local/bin/prometheus
sudo chown prometheus:prometheus /usr/local/bin/promtool

# Populate configuration files
#cat ./prometheus/prometheus.yml | sudo tee /etc/prometheus/prometheus.yml
#cat ./prometheus/prometheus.rules.yml | sudo tee /etc/prometheus/prometheus.rules.yml
cat <<EOF | sudo tee /etc/systemd/system/prometheus.service
[Unit]
Description=Prometheus
Wants=network-online.target
After=network-online.target

[Service]
User=prometheus
Group=prometheus
Type=simple
ExecStart=/usr/local/bin/prometheus \
        --config.file /etc/prometheus/prometheus.yml \
        --storage.tsdb.path /var/lib/prometheus/ \
        --web.console.templates=/etc/prometheus/consoles \
        --web.console.libraries=/etc/prometheus/console_libraries

[Install]
WantedBy=multi-user.target
EOF
# systemd
sudo systemctl daemon-reload
sudo systemctl enable prometheus
sudo systemctl start prometheus

# Installation cleanup
#rm prometheus-${VERSION}.linux-amd64.tar.gz
#rm -rf prometheus-${VERSION}.linux-amd64
}

Prometheus_Server_install
This script generates a Prometheus service.
Ensure the user mentioned in the
/etc/systemd/system/prometheus.servicePrometheus service has permissions to trigger Prometheus.
Loki and Promtail
Loki is a log aggregation system designed to store and query logs, while Promtail is an agent that collects logs and forwards them to Loki.
Download Loki:
wget https://github.com/grafana/loki/releases/download/v3.0.0/loki-3.0.0.x86_64.rpmDownload Promtail:
wget https://github.com/grafana/loki/releases/download/v3.0.0/promtail-3.0.0.x86_64.rpmExtract the RPM files onto the appropriate machines:
sudo rpm -i ~/loki-3.0.0.x86_64.rpm
rpm -i promtail-3.0.0.x86_64.rpm
Open the
loki.servicefile:sudo vim /etc/systemd/system/loki.serviceConfigure the service file:
[Unit]
Description=Loki

[Service]
ExecStart=/usr/bin/loki -config.file=<LOKI_YML>
User=root
Group=<GROUP>

[Install]
WantedBy=multi-user.target
Reload systemd to recognize the new service:
systemctl daemon-reloadRestart the Promtail service:
sudo systemctl restart promtail
Exporters
An Exporter is a software component that gathers metrics from various sources (such as hardware, software, or services) and exposes them in a format that Prometheus can scrape and store.
Download `Exporters<https://github.com/utkuozdemir/nvidia_gpu_exporter/releases>`_.
Install Exporters:
rpm -i <rpm_file>Reload your system:
sudo systemctl daemon-reloadRestart Exporters service:
sudo systemctl restart nvidia_gpu_exporter
CPU Exporter
Download the CPU Exporter.
Extract package content:
tar -xvf <package>Move the
node_exporterbinary to the/usr/bin directory:sudo mv <node_exporter_folder>/node_exporter /usr/binOpen the
/etc/systemd/system/node_exporter.servicefile:sudo vim /etc/systemd/system/node_exporter.service
Add the following to the service file:
[Unit]
Description=Node Exporter
Wants=network-online.target
After=network-online.target

[Service]
User=prometheus
Group=prometheus
Restart=always
SyslogIdentifier=prometheus
ExecStart=/usr/bin/node_exporter

[Install]
WantedBy=default.target
Reload the systemd manager configuration:
sudo systemctl daemon-reloadRestart the Node Exporter service managed by systemd
sudo systemctl restart node_exporter
Process Exporter
(Prometheus Exporter installation)-Slavi
Start the Exporter:
/usr/bin/process-exporter --config.path /etc/process-exporter/all.yaml --web.listen-address=:9256 &> process_exporter.out &
Deployment
Grafana
Access the Grafana web interface by entering your server IP or host name to the following URL:
http://<server ip or host name>:3000/Type in
adminfor both user name and password.Change your password.
Go to Data Sources and choose prometheus.
Go to Data Sources and choose loki.
Set URL as your Prometheus server ip.
Go to Dashboards and choose Import.
Import dashboards one by one.
Using the Monitor Service
The Monitor service package includes two files (which must be placed in the same folder):
monitor_service(an executable)monitor_input.json
Configuring the Monitor Service Worker
Before running the monitor service worker, ensure the following Sqream configuration flags are properly set:
Flag |
Configuration File |
Description |
|---|---|---|
|
This setting disables GPU memory usage for the monitor service. Consequently, the Worker must be a non-GPU Worker to avoid exceptions from the monitor service. |
|
|
This configuration specifies that the monitor service should run on a non-GPU Worker. To avoid mixing with GPU Worker processes, the monitor service is set to operate on a designated non-GPU Worker. By default, it runs under the service name |
|
|
Enabling this flag while using a non-GPU Worker results in exceptions. Ensure this flag is turned off to avoid issues since there are no GPU instances involved. |
Execution Arguments
When executing the Monitor service, you can configure the following flags:
Flag |
Type |
Description |
State |
Default |
|---|---|---|---|---|
|
option |
Shows help message |
||
|
string |
The SQreamDB host address |
Optional |
|
|
integer |
The SQreamDB port number |
Optional |
|
|
string |
The SQreamDB database name |
Optional |
|
|
string |
The SQreamDB username |
Mandatory |
|
|
string |
The SQreamDB password |
Mandatory |
|
|
option |
An option if the |
Optional |
|
|
string |
The SQreamDB service name |
Optional |
|
|
string |
The Loki instance host address |
Optional |
|
|
integer |
The Loki port number |
Optional |
|
|
string |
The path to where log files are saved |
Optional |
NA |
|
string |
The path to where the |
Optional |
Example
Execution example:
./monitor_service --username=sqream --password=sqream --host=1.2.3.4 --port=2711 --service=monitor --loki_host=1.2.3.5 --loki_port=3100 --metrics_json_path='/home/arielw/monitor_service/monitor_input.json'
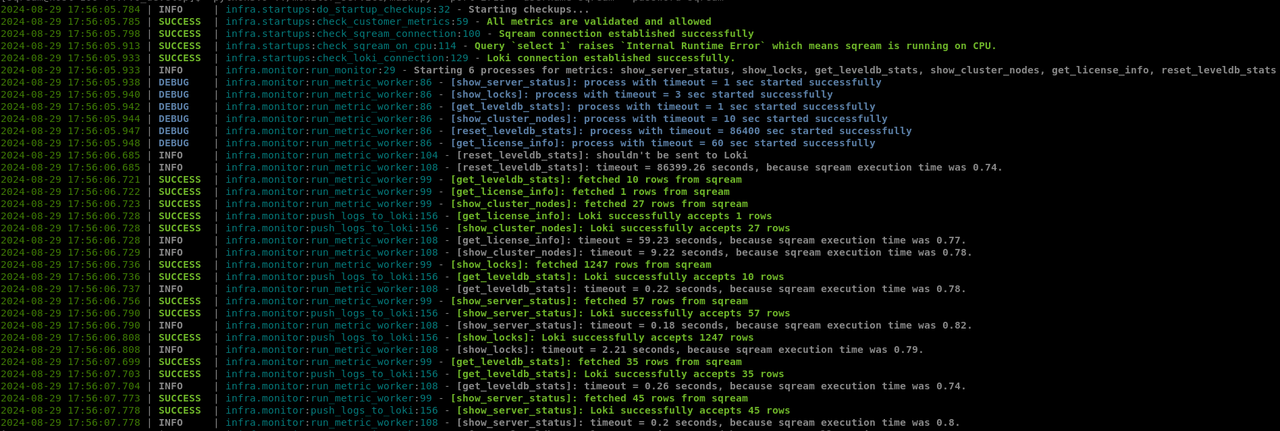
Monitor Service Output Example
Type |
Color |
|---|---|
Information about monitor service triggering |
Blue |
Successful insertion |
Green |
Error |
Red |