March 2024
Monitoring Loads
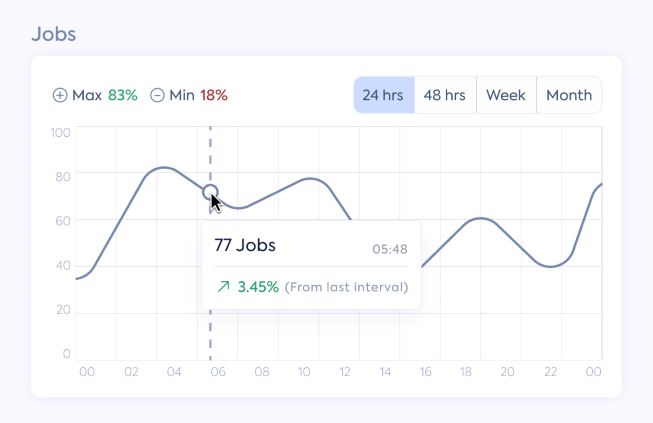
The Dashboard serves as a tool for you to monitor and promptly respond to any changes within your system. It enables you to track the health of your system and ensures that your workloads are operating as expected in near real-time.
Jobs monitoring example:
DESCRIBE SESSION QUERIES Enhancement
The DESCRIBE SESSION QUERIES command outputs a list of queries per session, including queued queries. You can now list queries in multiple sessions.
Example:
DESCRIBE SESSION QUERIES STATUS IN FETCHING_RESULTS, COMPILING;
Support Access
Facilitating a seamless and effortless support experience by authorizing the BLUE Support Team with Temporary Access. This proactive action will be undertaken by a cluster admin for a predetermined duration.
DESCRIBE COLUMNS Enhancement
The DESCRIBE COLUMNS command now lets you list information about table and view columns.
See DESCRIBE COLUMNS