Quick Tour
Executing Statements
The Workbench provides a comprehensive environment for writing, managing, and optimizing statements.
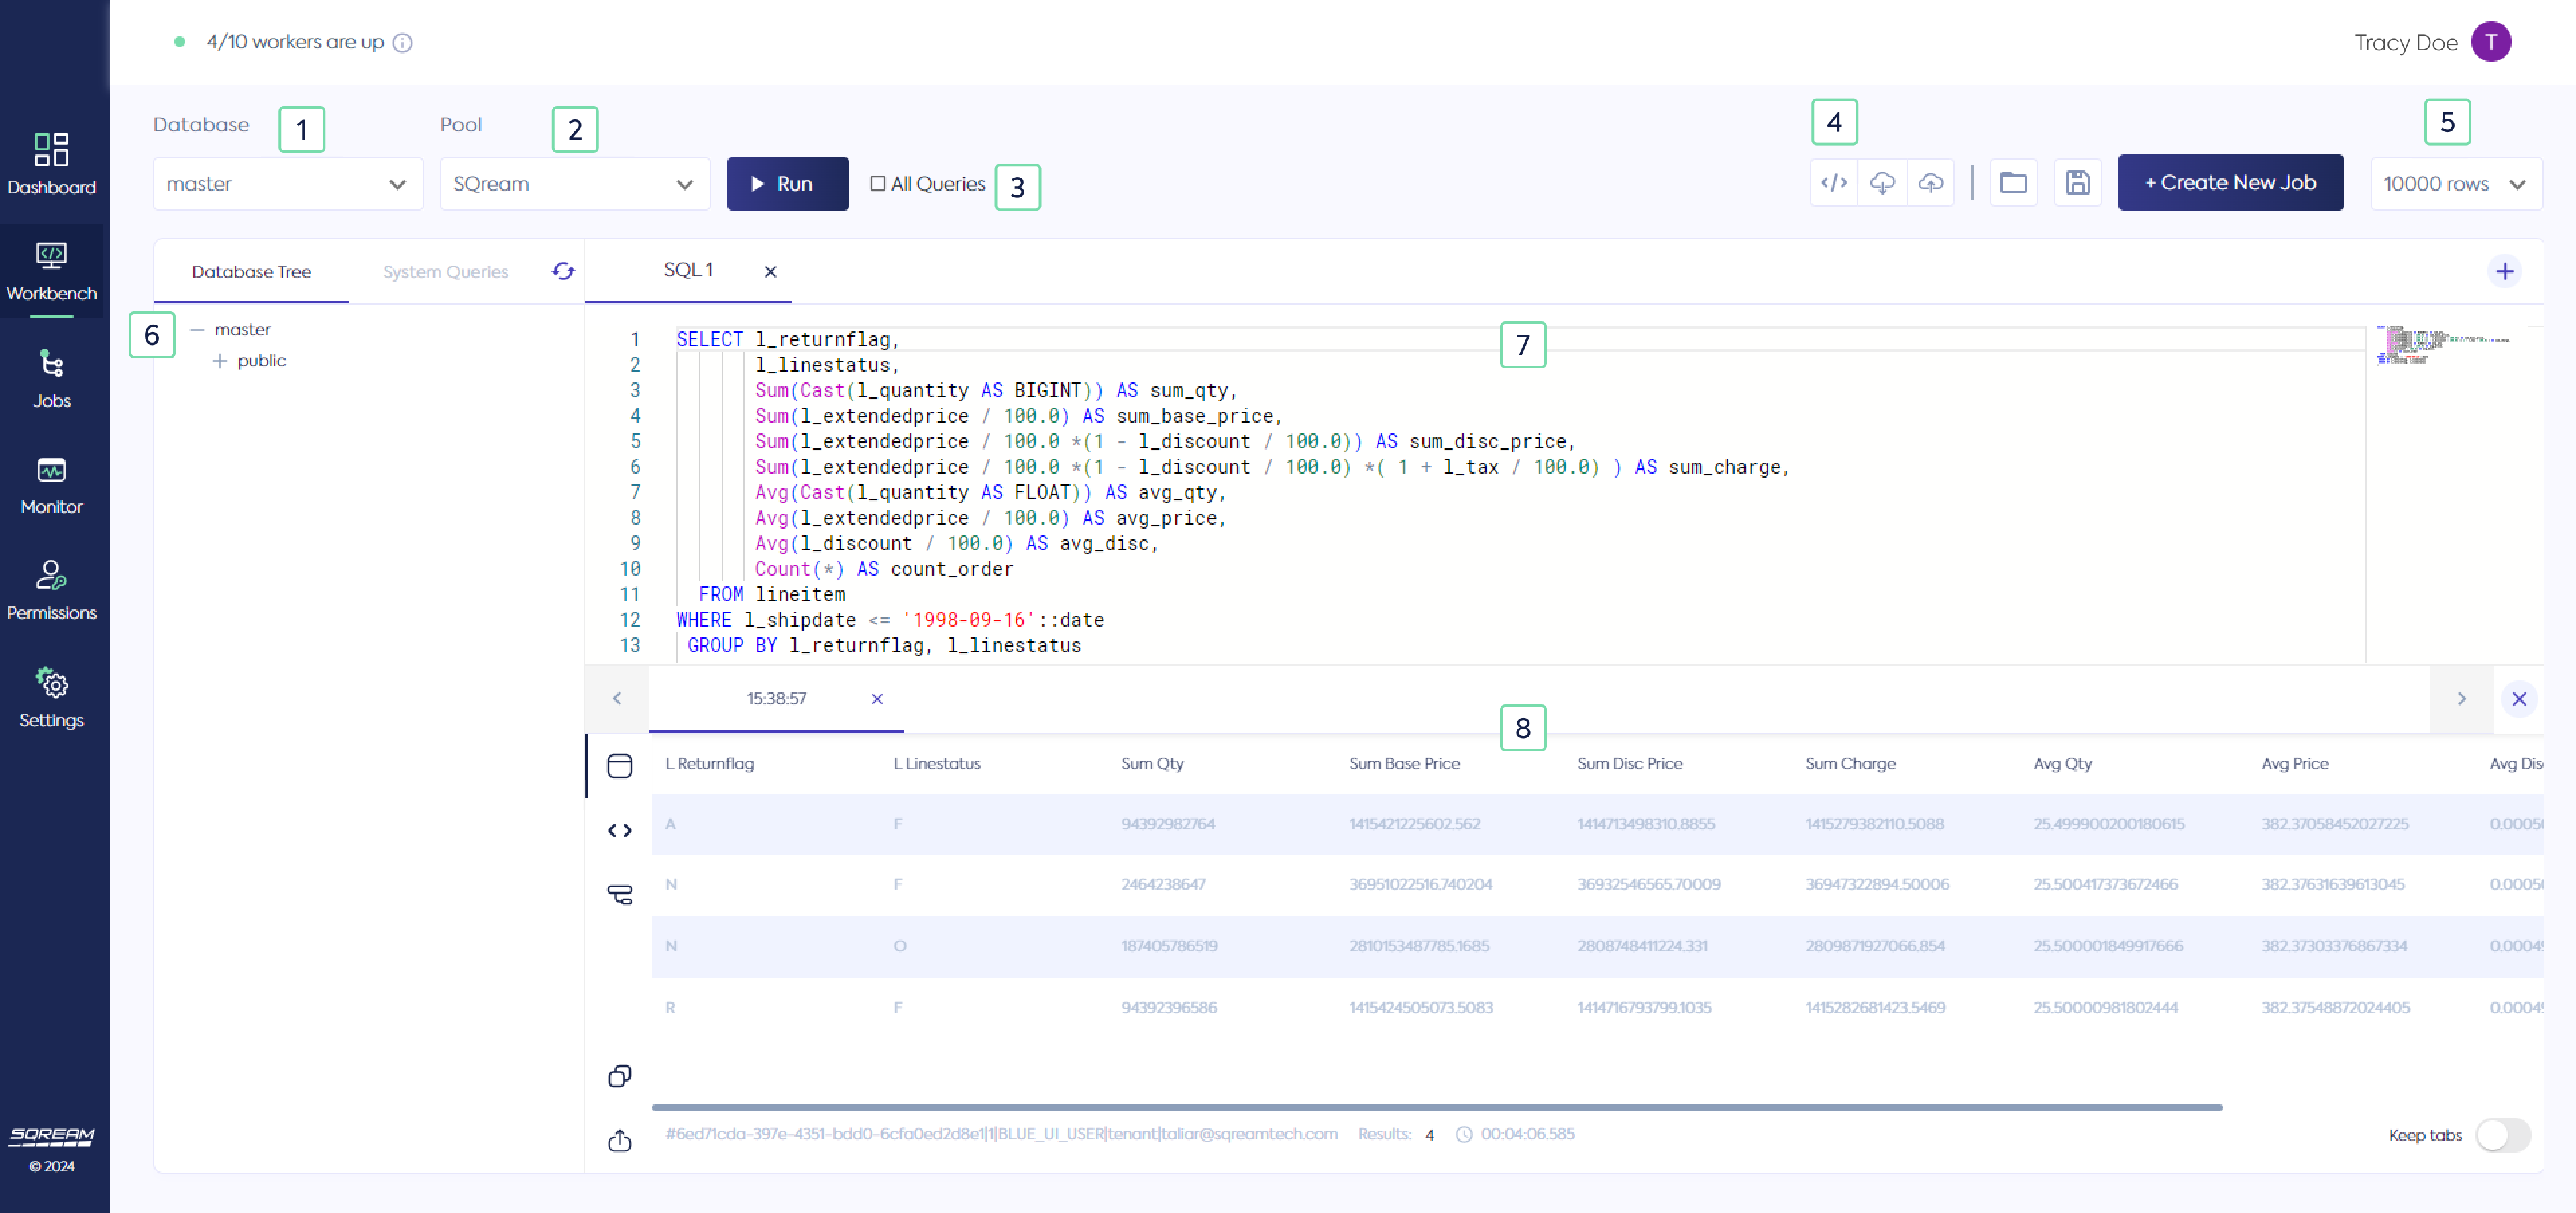
Database Navigator (which includes sample data ready for you to play around with)
Resource Pool Navigator
Execution Controls
Script Handlers:
Format SQL
Download Script from Cloud
Upload Script to Cloud
Load a Query from Local File
Save Query to Local File
Limit Rows
Schema Browser:
Database Tree
System Queries
Statement Editor
Result Pane:
Result Table
Result Statement
Execution Tree
Copy Execution Plan
Export Results
Managing Workflows
Jobs » All Jobs
The Jobs page is where you can create, execute, and manage your SQL and Python workflows. It displays a list of existing Jobs along with the following information for each Job:
Job Name
Creation Time
Owner
Last Runtime
Next Runtime
Frequency
Status
More about executing, monitoring, and managing Jobs
Monitoring Your Cluster
The Dashboard serves as a tool for you to monitor and promptly respond to any changes within your cluster. It enables you to track the health of your cluster and ensures that your workloads are operating as expected in near real-time.
Reading the Dashboard Charts
The Dashboard charts offer a comprehensive overview of Worker performance, detailing:
Chart |
Description |
Sampling Interval |
Timeframe Options |
|---|---|---|---|
Worker Loads |
This measures the average load on the system within a specified timeframe. It’s calculated based on the execution time of statements and the number of workers engaged, relative to the processing capacity during that period. |
15 seconds |
24/48/ hrs, past week, past month |
Queued Statements |
This indicates the number of statements awaiting execution in the queue over a specific timeframe. |
15 seconds |
24/48/ hrs, past week, past month |
Jobs |
This indicates the total number of executed Jobs within a specific timeframe. |
1 hour |
Week, past 2 weeks, past month |
Tasks |
This indicates the total number of executed Tasks within a specific timeframe. |
1 hour |
Week, past 2 weeks, past month |
Evaluating Real-Time Cluster Workloads
The Dashboard has a panel which provides real-time workload overview of your Currently Running:
Queued statements
Statements
Jobs
And a Monthly Usage panel with an overview of your monthly cluster:
Uptime (in minutes)
Data Read (in bytes)
Rows Read
These panels also timestamp latest updates, enabling you to follow the evolution of changes with precision.
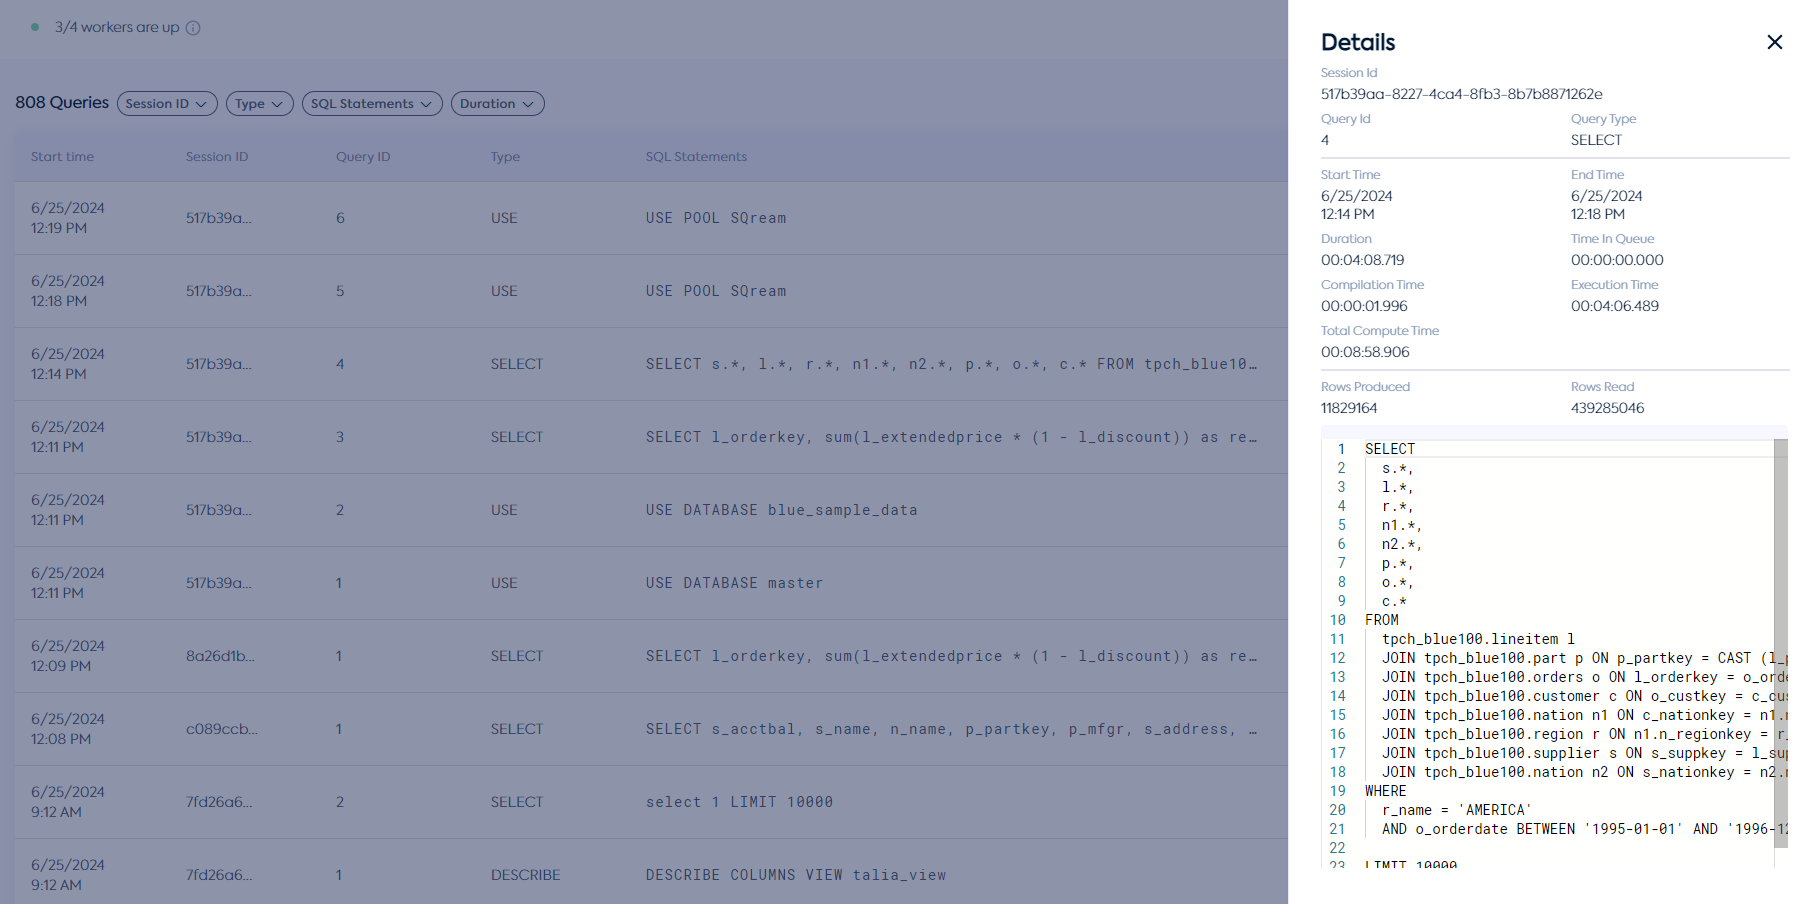
Monitoring Web Interface Activity
The Activity page provides a detailed overview of your actions initiated via the web interface. It displays a table with all executed statements along with the following details:
Start time
Session ID
Query ID
Type
SQL Statements
Duration (also shows failed statements)
Execution Plan (read more here)
You may also filter the information by Session ID, Type, SQL Statements (script), and Duration.
To view the full details of an executed statement, hover over the desired row and click on it. This action will open a side window displaying comprehensive execution details, as illustrated in the example below:
Administrating Your Cluster
Scaling your Cluster
Settings » Worker Kit »
Navigate through different Worker kits to accommodate heavy loads or optimize resources during periods of low activity.
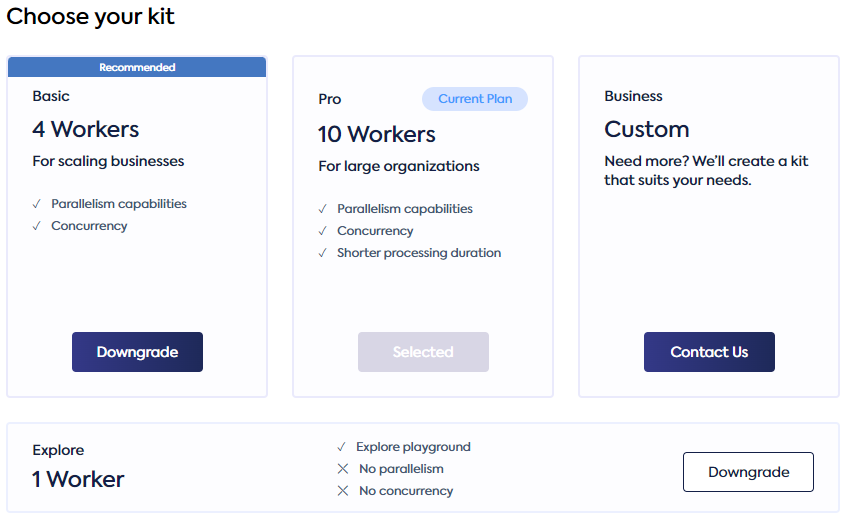
More about scaling your cluster
Suspending and Resuming Your Cluster
Settings » Resource Pool »
Configure your cluster to automatically enter a suspended state during idle periods and automatically resume when statements or jobs are executed. Customize performance and concurrency preferences to optimize cluster usage.
Please note that suspension and resumption are configured on a per-resource pool basis.
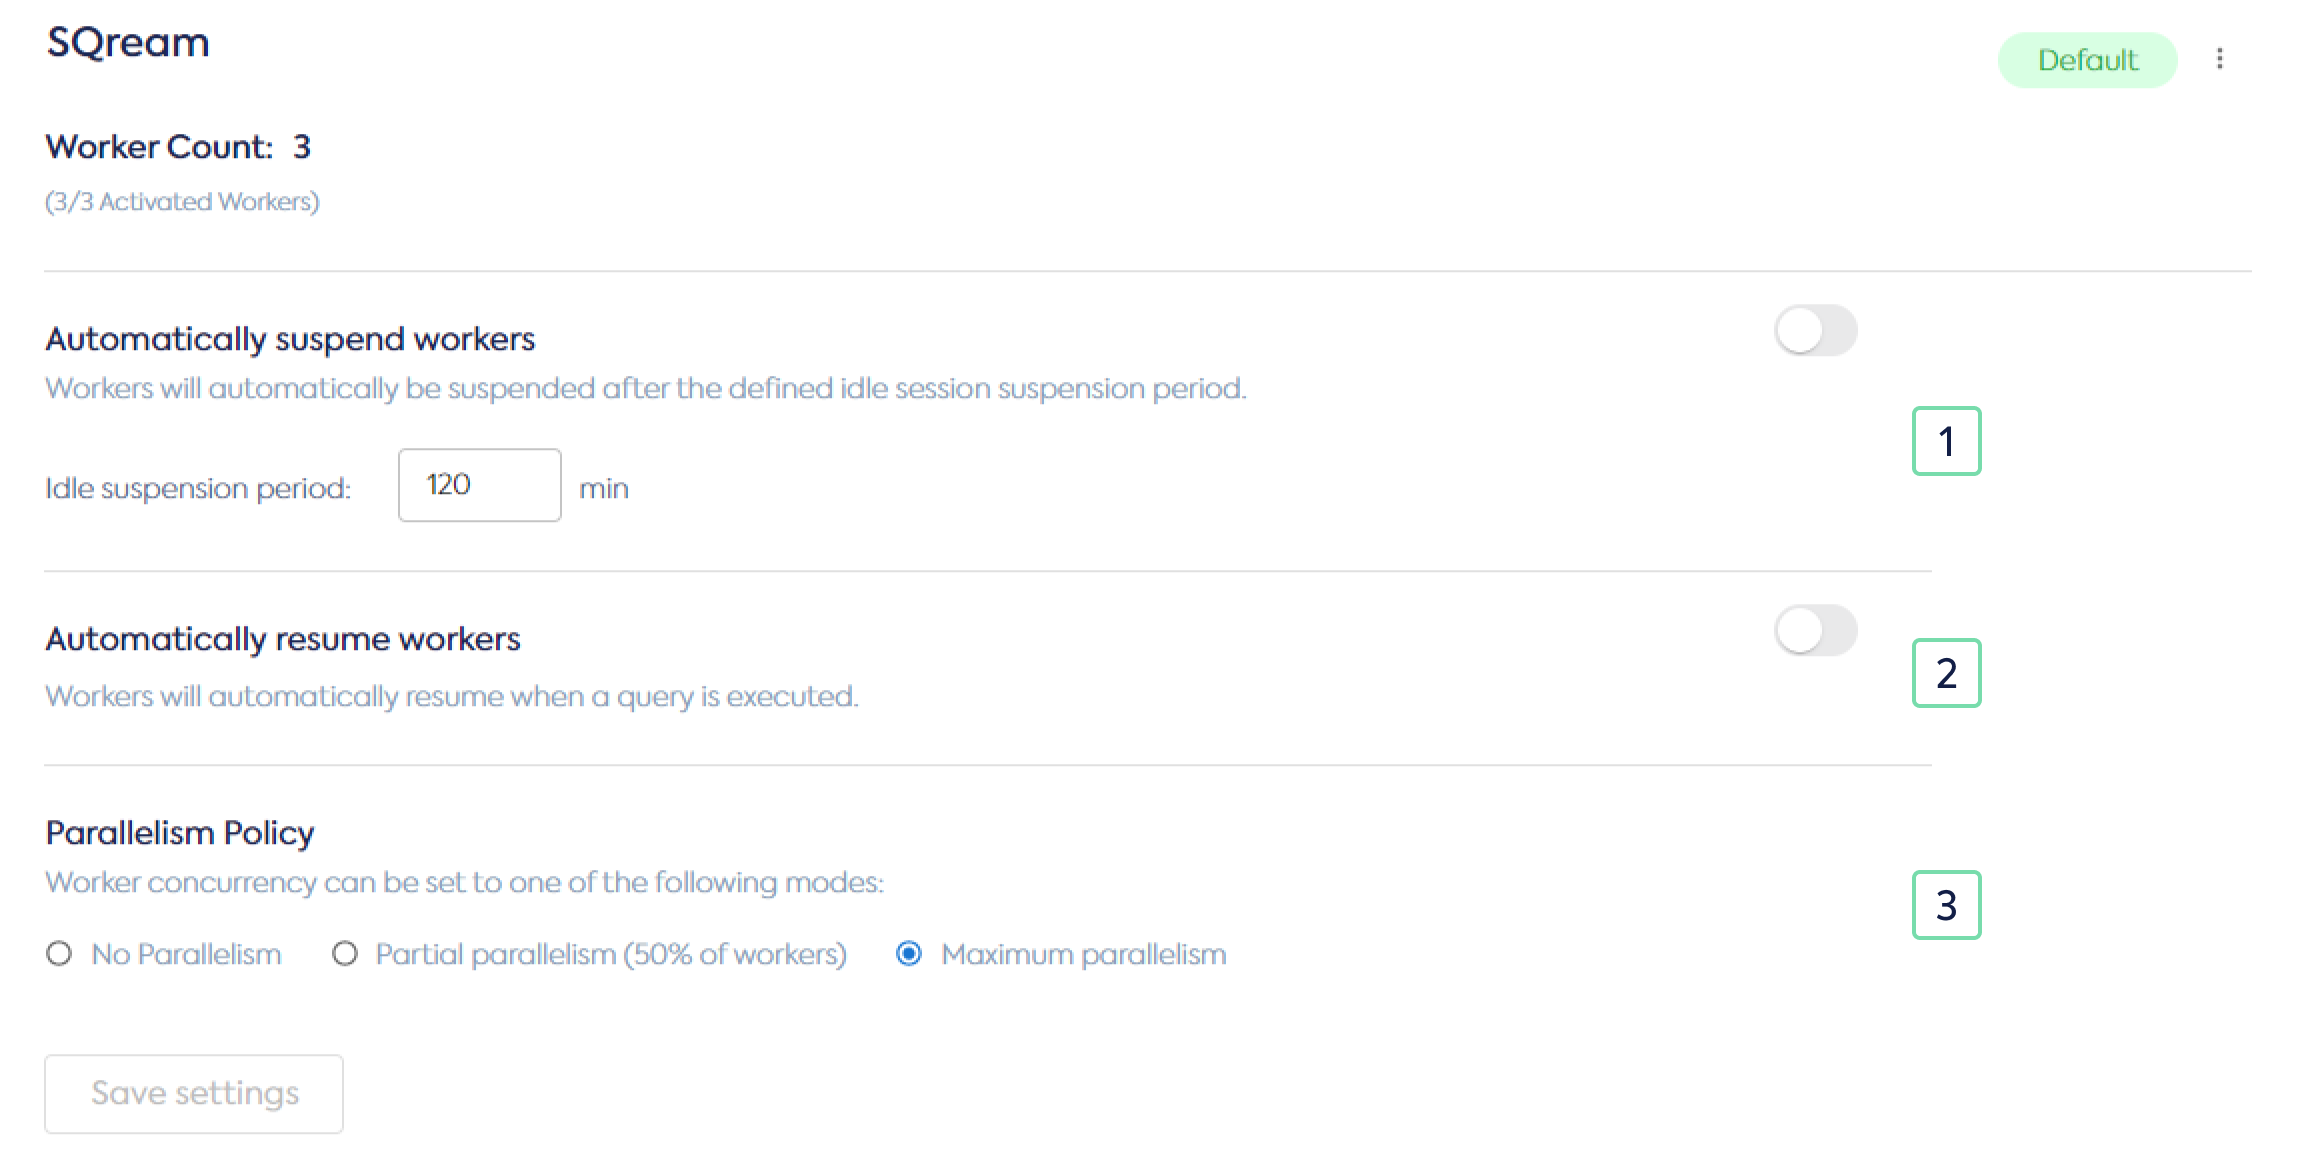
Automatic suspension
Automatic resumption
Performance Vs. concurrency
Define the conditions under which your cluster will shut down.

Suspension policy for automatic suspension mode
Immediate suspension / resumption button
More about suspending and resuming your cluster
Managing Execution Queue
Settings » Resource Pool »
Managing your execution queue is crucial for ensuring system resources are used optimally, avoiding bottlenecks, and preventing query starvation.
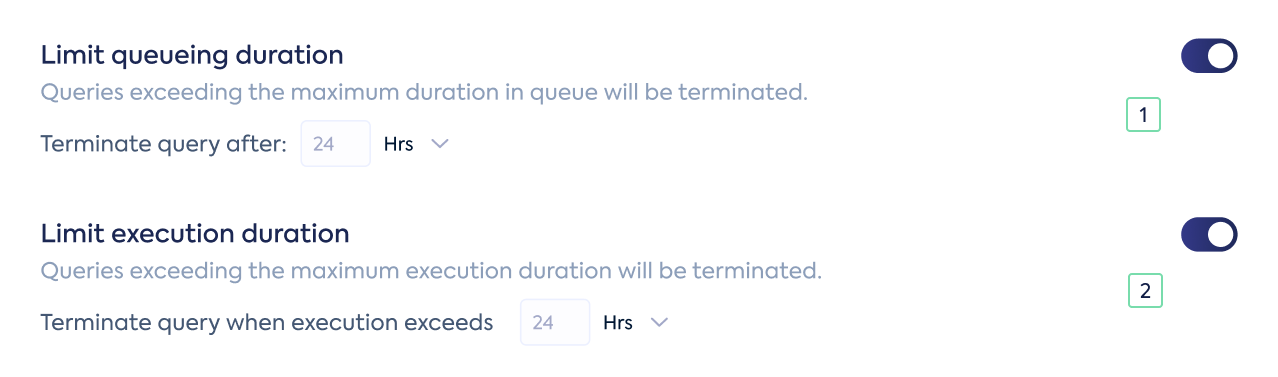
Limit the time each query can wait in queue to be executed
Limit the time each query can execute
Please note that execution queue management is configured on a per-resource pool basis.